Digitization help student to explore and study their academic courses online, as this gives them flexibility and scheduling their learning at their convenience. Kidsfront has prepared unique course material of Arithmetic Ability Pie Chart for RRB NTPC Exam student. This free online Arithmetic Ability study material for RRB NTPC Exam will help students in learning and doing practice on Pie Chart topic of RRB NTPC Exam Arithmetic Ability . The study material on Pie Chart, help RRB NTPC Exam Arithmetic Ability students to learn every aspect of Pie Chart and prepare themselves for exams by doing online test exercise for Pie Chart, as their study progresses in class. Kidsfront provide unique pattern of learning Arithmetic Ability with free online comprehensive study material and loads of RRB NTPC Exam Arithmetic Ability Pie Chart exercise prepared by the highly professionals team. Students can understand Pie Chart concept easily and consolidate their learning by doing practice test on Pie Chart regularly till they excel in Arithmetic Ability Pie Chart.
 The pie charts, given here show some automobile parts
manufactured by an automobile company at its Pune and Nagpur plants in the year
2009.
Study the pie charts and answer question numbers 148 150
based on them.
The pie charts, given here show some automobile parts
manufactured by an automobile company at its Pune and Nagpur plants in the year
2009.
Study the pie charts and answer question numbers 148 150
based on them.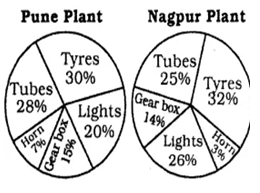 If the Nagpur plant produced 8,00,000 tyres, then the number of horns produced by it
was
If the Nagpur plant produced 8,00,000 tyres, then the number of horns produced by it
was Correct Answer Is : 75000 The pie charts, given here show some automobile parts
manufactured by an automobile company at its Pune and Nagpur plants in the year
2009.
Study the pie charts and answer question numbers 148 150
based on them. Correct Answer Is : 12 The pie charts, given here show some automobile parts
manufactured by an automobile company at its Pune and Nagpur plants in the year
2009.
Study the pie charts and answer question numbers 148 150
based on them.
Correct Answer Is : 75000 The pie charts, given here show some automobile parts
manufactured by an automobile company at its Pune and Nagpur plants in the year
2009.
Study the pie charts and answer question numbers 148 150
based on them. Correct Answer Is : 12 The pie charts, given here show some automobile parts
manufactured by an automobile company at its Pune and Nagpur plants in the year
2009.
Study the pie charts and answer question numbers 148 150
based on them. Correct Answer Is : 3 : 7 The following Pie chart shows the contents of insects and rodents in an average Indian Household . Examine the chart and answer the question .
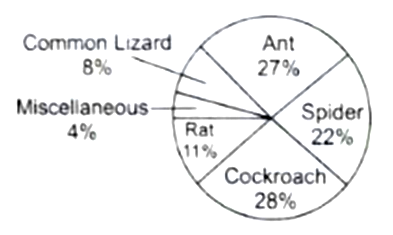 If the percentage of spider is x% of the percentage of cockroach , then x is equal to Correct Answer Is : 78 4/7 % The following Pie chart shows the contents of insects and rodents in an average Indian Household . Examine the chart and answer the question . Correct Answer Is : 0.34 The following Pie chart shows the contents of insects and rodents in an average Indian Household . Examine the chart and answer the question .If the percentage of rat is y % of the total percentage of ant and cockroach , then y is equal to Correct Answer Is : 0.2 The following Pie chart shows the contents of insects and rodents in an average Indian Household . Examine the chart and answer the question . Correct Answer Is : 0.47 The following Pie chart shows the contents of insects and rodents in an average Indian Household . Examine the chart and answer the question .If the difference of the percentage of rat and miscellaneous by z % of the percentage of cockroach , then z is equal to Correct Answer Is : 25 % The following pie chart shows the performance in an examination in a particular year for 360 students. Study the pie chart and answer the question
 Thenumber of students who passed in first division is Correct Answer Is : 54 The following pie chart shows the performance in an examination in a particular year for 360 students. Study the pie chart and answer the question
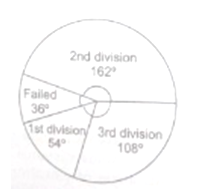 Thenumber of students who passed in second division is more than those in first division by Correct Answer Is : 108