Digitization help student to explore and study their academic courses online, as this gives them flexibility and scheduling their learning at their convenience. Kidsfront has prepared unique course material of Numerical Ability Graphs for Delhi Police Exam student. This free online Numerical Ability study material for Delhi Police Exam will help students in learning and doing practice on Graphs topic of Delhi Police Exam Numerical Ability. The study material on Graphs, help Delhi Police Exam Numerical Ability students to learn every aspect of Graphs and prepare themselves for exams by doing online test exercise for Graphs, as their study progresses in class. Kidsfront provide unique pattern of learning Numerical Ability with free online comprehensive study material and loads of Delhi Police Exam Numerical Ability Graphs exercise prepared by the highly professionals team. Students can understand Graphs concept easily and consolidate their learning by doing practice test on Graphs regularly till they excel in Numerical Ability Graphs.
 The following group shows the number of people owing two wheelers in 7 different town Study the graph and answer the questions
.png)
 Correct Answer Is : Town C The following group shows the number of people owing two wheelers in 7 different town Study the graph and answer the questions Correct Answer Is : 3 Read the graph and asnwer the question .
 Correct Answer Is : 5 Read the graph and asnwer the question .
 Correct Answer Is : 10 Read the graph and asnwer the question .
 Thenumber of years in which the income is more than the average income of the given years is , Correct Answer Is : Three Read the graph and asnwer the question .
 Correct Answer Is : 48 : 17 Read the graph and asnwer the question .
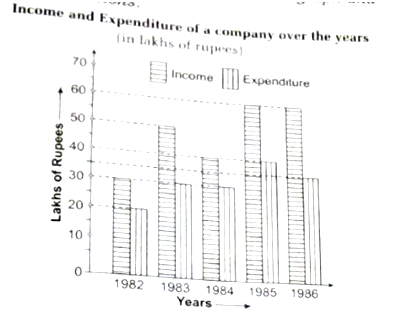 Correct Answer Is : 150 % Read the graph and asnwer the question .
 Correct Answer Is : 85 lakh Study the graph and answer the question
Demand and Prodection of Color TV Sets of Five companies A, B, C and D for October 2006 Correct Answer Is : 0.24 Study the graph and answer the question
Demand and Prodection of Color TV Sets of Five companies A, B, C and D for October 2006 Correct Answer Is : 280
Correct Answer Is : 85 lakh Study the graph and answer the question
Demand and Prodection of Color TV Sets of Five companies A, B, C and D for October 2006 Correct Answer Is : 0.24 Study the graph and answer the question
Demand and Prodection of Color TV Sets of Five companies A, B, C and D for October 2006 Correct Answer Is : 280