Digitization help student to explore and study their academic courses online, as this gives them flexibility and scheduling their learning at their convenience. Kidsfront has prepared unique course material of Numerical Ability Graphs for Delhi Police Exam student. This free online Numerical Ability study material for Delhi Police Exam will help students in learning and doing practice on Graphs topic of Delhi Police Exam Numerical Ability. The study material on Graphs, help Delhi Police Exam Numerical Ability students to learn every aspect of Graphs and prepare themselves for exams by doing online test exercise for Graphs, as their study progresses in class. Kidsfront provide unique pattern of learning Numerical Ability with free online comprehensive study material and loads of Delhi Police Exam Numerical Ability Graphs exercise prepared by the highly professionals team. Students can understand Graphs concept easily and consolidate their learning by doing practice test on Graphs regularly till they excel in Numerical Ability Graphs.
 Study the graph and answer the question
Demand and Prodection of Color TV Sets of Five companies A, B, C and D for October 2006
Study the graph and answer the question
Demand and Prodection of Color TV Sets of Five companies A, B, C and D for October 2006 Correct Answer Is : 86 : 147
 Study the graph and answer the question
Demand and Prodection of Color TV Sets of Five companies A, B, C and D for October 2006 Correct Answer Is : 3 : 2 Study the graph and answer the question
Demand and Prodection of Color TV Sets of Five companies A, B, C and D for October 2006 Correct Answer Is : 1.8 Study the graph and answer the question
Study the graph and answer the question
Demand and Prodection of Color TV Sets of Five companies A, B, C and D for October 2006 Correct Answer Is : 3 : 2 Study the graph and answer the question
Demand and Prodection of Color TV Sets of Five companies A, B, C and D for October 2006 Correct Answer Is : 1.8 Study the graph and answer the question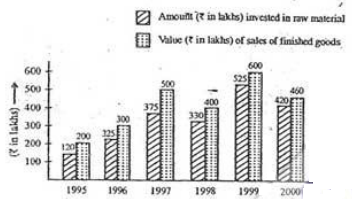 Correct Answer Is : 49 Study the graph and answer the question
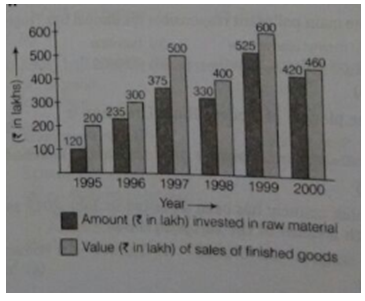 Correct Answer Is : 1997
  If the imports of company X in 2007 were increased by 40 % what would be the ratio of their exports to the increased imports ? Correct Answer Is : 1.75
 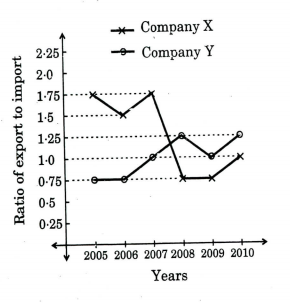 Correct Answer Is : 210
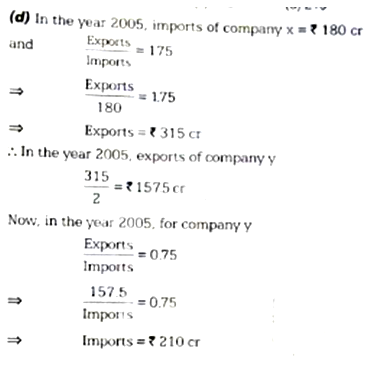 Study the graph carefully and answer the question
 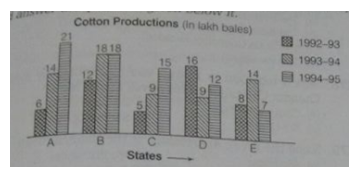 Correct Answer Is : 0.75
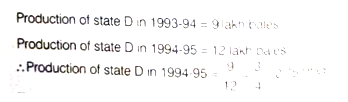 Study the graph carefully and answer the question Correct Answer Is : There was no improvement in the production of cotton in state B during 1994 - 95 Study the graph carefully and answer the question Correct Answer Is : 3