Digitization help student to explore and study their academic courses online, as this gives them flexibility and scheduling their learning at their convenience. Kidsfront has prepared unique course material of SSC CHSL Quantative Aptitude Graphs for SSC CHSL Exam student. This free online SSC CHSL Quantative Aptitude study material for SSC CHSL Exam will help students in learning and doing practice on Graphs topic of SSC CHSL Exam SSC CHSL Quantative Aptitude. The study material on Graphs, help SSC CHSL Exam SSC CHSL Quantative Aptitude students to learn every aspect of Graphs and prepare themselves for exams by doing online test exercise for Graphs, as their study progresses in class. Kidsfront provide unique pattern of learning SSC CHSL Quantative Aptitude with free online comprehensive study material and loads of SSC CHSL Exam SSC CHSL Quantative Aptitude Graphs exercise prepared by the highly professionals team. Students can understand Graphs concept easily and consolidate their learning by doing practice test on Graphs regularly till they excel in SSC CHSL Quantative Aptitude Graphs.
 Study the graph and answer the question
Demand and Prodection of Color TV Sets of Five companies A, B, C and D for October 2006
Study the graph and answer the question
Demand and Prodection of Color TV Sets of Five companies A, B, C and D for October 2006 Correct Answer Is : 86 : 147 Study the graph and answer the question
Demand and Prodection of Color TV Sets of Five companies A, B, C and D for October 2006 Correct Answer Is : 3 : 2 Study the graph carefully and answer the question
Correct Answer Is : 86 : 147 Study the graph and answer the question
Demand and Prodection of Color TV Sets of Five companies A, B, C and D for October 2006 Correct Answer Is : 3 : 2 Study the graph carefully and answer the question 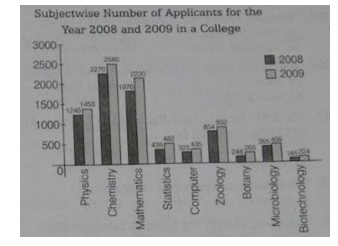 Thenumber of physics seeking applicants increased by , Correct Answer Is : 17.26% Study the graph carefully and answer the question Thenumber of mathematics seeking applicants increased by Correct Answer Is : 19.25% Study the graph and answer the question
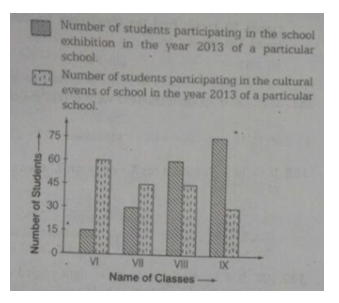 Correct Answer Is : Class IX Study the graph and answer the question Correct Answer Is : 45 Study the graph and answer the question Correct Answer Is : 52.5 Study the graph and answer the question Correct Answer Is : 5:7 Study the graph and answer the question Correct Answer Is : 25% Study the graph carefully and answer the question given below
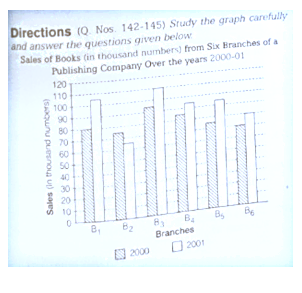 Total sale of branches B1 , B3 and B5 together for both the years( in thousand numbers ) is Correct Answer Is : 560