Digitization help student to explore and study their academic courses online, as this gives them flexibility and scheduling their learning at their convenience. Kidsfront has prepared unique course material of Mathematics Bar diagram for NDA Exam student. This free online Mathematics study material for NDA Exam will help students in learning and doing practice on Bar diagram topic of NDA Exam Mathematics. The study material on Bar diagram, help NDA Exam Mathematics students to learn every aspect of Bar diagram and prepare themselves for exams by doing online test exercise for Bar diagram, as their study progresses in class. Kidsfront provide unique pattern of learning Mathematics with free online comprehensive study material and loads of NDA Exam Mathematics Bar diagram exercise prepared by the highly professionals team. Students can understand Bar diagram concept easily and consolidate their learning by doing practice test on Bar diagram regularly till they excel in Mathematics Bar diagram.
 The following bar diagram represents the use of different modes of travel to school by students in a certain locality of the down. Study the graph and answer the questions.
.png)
 Correct Answer Is : 660 The following bar diagram represents the use of different modes of travel to school by students in a certain locality of the down. Study the graph and answer the questions.
Correct Answer Is : 340 The following bar diagram represents the use of different modes of travel to school by students in a certain locality of the down. Study the graph and answer the questions.
Correct Answer Is : 22.73% Study the following bar-diagram carefully and answer the given question
Correct Answer Is : 660 The following bar diagram represents the use of different modes of travel to school by students in a certain locality of the down. Study the graph and answer the questions.
Correct Answer Is : 340 The following bar diagram represents the use of different modes of travel to school by students in a certain locality of the down. Study the graph and answer the questions.
Correct Answer Is : 22.73% Study the following bar-diagram carefully and answer the given question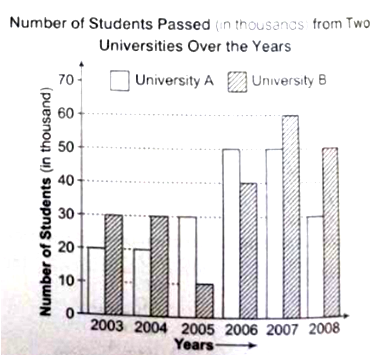 Correct Answer Is : 80000 Study the following bar-diagram carefully and answer the given question Correct Answer Is : 5 : 3 Study the following bar-diagram carefully and answer the given question Correct Answer Is : 25 Study the following bar-diagram carefully and answer the given question Correct Answer Is : 6 : 3 : 3 Study the following bar-diagram carefully and answer the given question Correct Answer Is : 30000 The following is a horizontal bar diagram showing the accidents in which two wheelers are involved with other objects . Study the diagram and answer the question .
  Correct Answer Is : 24% The following is a horizontal bar diagram showing the accidents in which two wheelers are involved with other objects . Study the diagram and answer the question .
 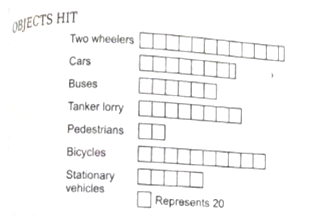 Correct Answer Is : 4%